

Valitse alue, jossa on integroidut palvelut; valitse kompakteja, energiatehokkaita asuntoja; luota nopeaan joukkoliikenteeseen. Tämä kokonaisuus vähentää kuukausittaisia menoja ennen pandemian jälkeisiä muutoksia, tarjoten vastinetta yhdelle ammattilaiselle tai pienelle kotitaloudelle.
Venäjän pääkaupungissa yksiö ydinalueella maksaa yleensä 60-90k ruplaa kuukaudessa; ydinalueiden ulkopuolella tyypillinen hinta on 30-50k. Kuukausittaiset ruokaostokset ovat noin 14-22k ruplaa; sähkö, vesi ja lämmitys noin 6-12k ruplaa; matkakortti lähellä 2-4k ruplaa. Vuosittaiset tilaukset palveluihin nousevat yleensä 0,5-1,0 miljoonaan ruplaan perheille; sinkut käyttävät vähemmän.
Taide-elämän laadulla on merkitystä; lähestymistapa kuvaa hintahaitarin, paikallisten esitysten ja julkisten tapahtumien yhdistelmää. Kaikesta huolimatta paras vastine löytyy alueilla, joissa on valkoiset julkisivut ja jotka tarjoavat integroituja ohjelmia, näyttelyitä ja katutapahtumia. Valppaus vapaapäivien, tukien ja palveluiden suhteen auttaa asukkaita kalibroimaan odotuksia.
Useita mittareita käytetään yleisesti kuvaamaan sijainteja, mukaan lukien hintasignaalit, joukkoliikenteen kattavuus, koulutusmahdollisuudet ja vapaa-ajanviettomahdollisuudet. Nämä on kuvattu kunnallisissa katsauksissa; määritä painoarvo asunnolle, sähkölle, vedelle, lämmitykselle, aterioille ja palveluille. Rauhanajan budjetit paljastavat miljardeja ruplia, mikä vaikuttaa odotuksiin epävakaudesta. Olitpa tarkastelemassa tätä lyhyen aikavälin näkökulmasta tai pitkäaikainen suunnittelu on edelleen olennaista, ylläpitäen vanhempia alueita, joissa on valkoiset julkisivut, tarjoten integroituja ohjelmia; valppaus suojaa arvoa samalla kun tuetaan kulttuurisia vaihtoehtoja. Keskeisiä tekijöitä ovat verot, liikenteen luotettavuus ja koulutuksen laatu; kulujen jälkeen ei jää juurikaan liikkumavaraa.
Ennen lopullista päätöstä, suorita kahden viikon kokeilu kohdealueella; kirjaa palveluiden laatu, liikenteen luotettavuus ja vapaa-ajanviettomahdollisuudet. Kokeilun jälkeen säädä prioriteetteja käytännöllisten solmukohtien suuntaan, vaikka hintasignaalit muuttuisivat. Etsitpä sitten nopeaa pääsyä mukavuuksiin tai kestävää pääomaa, säilytä valppaus budjetoinnissa; dokumentoi tulokset, määritä pistemäärä, pidä vaihtoehdot joustavina.
Moskova vertailussa: Elinkustannukset ja kulttuuri vs. 20 globaalia metropolia, mukaan lukien aasialainen joukkoliikenneverkosto 5p hinnoilla
Suositus: rakenna painotettu indeksi kahdeksasta mittarista metropolien vertailuun; tämä tuottaa tiiviin, toimivan näkymän suunnittelijoille ja matkailijoille.
Keskeisiä mittareita ovat aseman tiheys (metro, maanalainen), liitettävyys, hinnat, asuntokanta, kulttuurikohteet, museoiden määrä, rauhanajan toiminta ja hintahaitari.
Kahdeksassa metropolissa, joissa on suurin kävijämäärä, vilkkaimmat pysäkit osoittavat valppautta aseman hallinnassa; läpimeno liittyy turvallisuusprotokolliin.
Kiovan tapaus osoittaa erilaisen yhdistelmän: ikääntyvä infrastruktuuri, vahva liitettävyys, alhaisemmat asumiskustannukset, korkeammat sähkön, veden ja lämmityksen kulut. Ukrainan budjetit vaikuttavat pääomahankkeisiin; yhdistetyt tietojoukot parantavat luotettavuutta; kahdeksan arvoa muuttuu rauhanajan olosuhteissa.
Vaikuttava aasialainen joukkoliikenneverkosto 5p hinnoilla osoittaa vastinetta; tämä verkosto varastoi lippuja, mikä vähentää kitkaa matkustajille. Reittien valikoima edistää tiukkaa arvoehdotusta kaupunkiliikenteelle.
Faktapohjainen painotus käyttää numeroita; kahdeksan mittaria syöttää yhdistetyn pistemäärän; tiedot tallennetaan varastomuodossa nopeaa vertailua varten; arvo piilee rauhanajan modernisoinnissa.
| Metropoli | Alue | Elinkustannusindeksi | Kulttuuri-indeksi | Joukkoliikenteen hinnat | Asuntokanta | Liitettävyys | Huomautuksia |
|---|---|---|---|---|---|---|---|
| New York City | Pohjois-Amerikka | 95 | 78 | 2.75 | 72 | 90 | suurin metropoli; suuri aseman läpimeno; maanalainen verkosto; numerot |
| Lontoo | Eurooppa | 92 | 83 | 3.85 | 68 | 92 | vilkkaimmat käytävät; valppaus asemilla; perinteinen liikennekeskus |
| Pariisi | Eurooppa | 88 | 80 | 3.40 | 65 | 88 | historiallinen kulttuurivarasto; tiheä metro |
| Tokio | Aasia | 100 | 90 | 3.60 | 65 | 95 | vaikuttava tehokkuus; huipputoiminta |
| Soul | Aasia | 98 | 85 | 1.60 | 70 | 90 | puhtaat asemat; moderni järjestelmä |
| Singapore | Aasia | 105 | 88 | 0.85 | 72 | 96 | tehokas, korkea infrastruktuurin arvo |
| Hong Kong | Aasia | 110 | 92 | 1.20 | 66 | 94 | tiheä verkosto; tiukat markkinat |
| Shanghai | Aasia | 72 | 70 | 0.50 | 60 | 75 | nopea kapasiteetin kasvu; suuri varasto |
| Peking | Aasia | 76 | 68 | 0.75 | 58 | 78 | laaja verkosto; modernisointi |
| Sydney | Oseania | 85 | 75 | 3.00 | 68 | 85 | alueellinen keskus; vahva hallinto |
| Melbourne | Oseania | 88 | 77 | 3.20 | 70 | 87 | kulttuurinen intensiteetti; vakaa toiminta |
| Toronto | Pohjois-Amerikka | 78 | 72 | 2.60 | 66 | 77 | kasvava varasto; vankka liitettävyys |
| Vancouver | Pohjois-Amerikka | 76 | 74 | 2.20 | 70 | 78 | kestävä suunnittelu; tiukat asuntomarkkinat |
| Mexico City | Latinalainen Amerikka | 60 | 66 | 1.10 | 62 | 68 | suuri virtaus; infrastruktuurin päivitykset käynnissä |
| São Paulo | Latinalainen Amerikka | 70 | 62 | 1.25 | 64 | 70 | suuri varasto; liikenneuudistus käynnissä |
| Lagos | Afrikka | 62 | 58 | 0.75 | 60 | 66 | nopea kasvu; kapasiteetin rajoitukset |
| Mumbai | Aasia | 50 | 60 | 0.65 | 58 | 70 | historialliset reitit; laajennusprojektit |
| Delhi | Aasia | 55 | 63 | 0.55 | 60 | 72 | uusia linjoja lisätty; kaupunkien tiivistyminen |
| Kuala Lumpur | Aasia | 58 | 65 | 0.60 | 62 | 68 | alueellinen linkkikeskus; modernisointi |
| Aasialainen joukkoliikenneverkosto (5p hinnat) | Aasia | 60 | 75 | 0.05 | 65 | 90 | arvon vertailukohta; edullinen liikkuvuus vakaalla toiminnalla; rauhanajan testit |
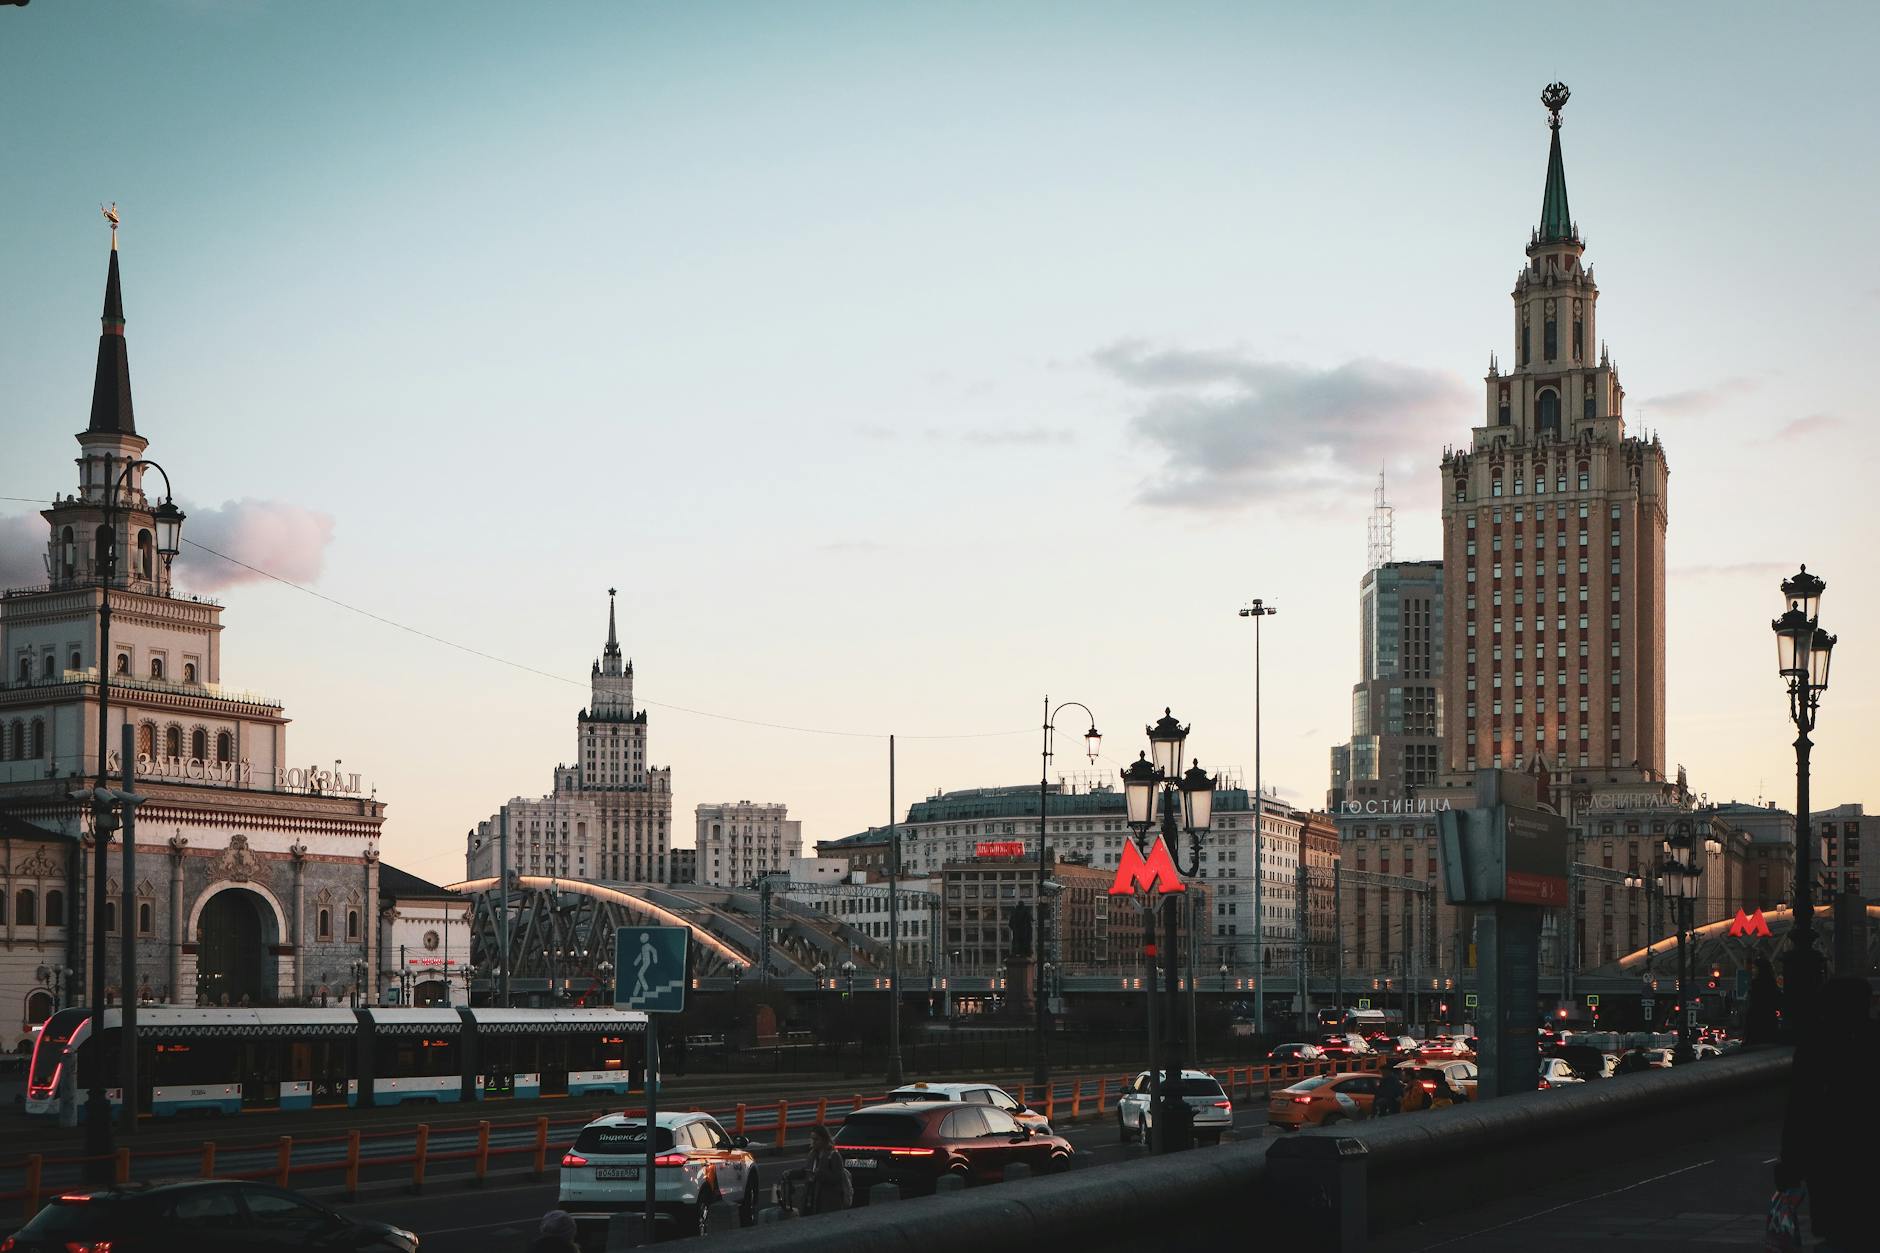
Asuminen ja sähkö, vesi, lämmitys: Moskovan vuokrat, laskut ja asuntokoot verrattuna suuriin maailman metropoleihin
Suositus: Valitse kompakti, hyvin eristetty yksiö lähellä rautateitä; suositeltavia vaihtoehtoja ovat sähkö, vesi ja lämmitys mittareilla kuukausittaisen kassavirran rajoittamiseksi.
Kokotiedot osoittavat, että keskusta-alueet tarjoavat 40-60 m2; ulommat vyöhykkeet tuottavat 25-45 m2; tyypillinen kaksio on 50-90 m2; vuokran osuus tuloista on usein alhaisin ytimen ulkopuolella; etäisyydet keskustaan ovat 1-3 kilometriä; joukkoliikenteen osuus on edelleen korkea; rautatiet ja raitiovaunut tarjoavat tiheää liikennettä; siinä on edelleen suurta vaihtelua; kuukausittaiset laskut lämmityksestä, kuumasta vedestä, sähköstä ja internetistä ovat noin 120-260 USD keskusta-alueilla; reuna-alueiden laskut ovat noin 80-180 USD; talven nousut nostavat kokonaissumman 320 USD:iin.
Edustavat luvut yksiöille suurissa metropoleissa (keskusta): NYC 3 000-4 800 USD; Lontoo 2 300-3 000 GBP; Pariisi 1 700-2 400 EUR; Tokio 240k-350k JPY (noin 2 000-3 000 USD); Singapore 3 800-5 800 SGD; Dubai 5 000-7 500 AED. Ulommat vyöhykkeet osoittavat alennuksia: NYC 2 000-3 000; Lontoo 1 300-2 000; Pariisi 1 200-1 900. Tässä pääkaupungissa sisemmät lähiöt 600-1 200 USD; asuminen vaihtelee suuresti; tällainen vertailu korostaa palkka-vuokra-eroja massamarkkinoilla. Kamyshin esittää vastakohdan: että yksiö lähellä rautateitä on 15 000-25 000 ruplaa kaupungin keskustassa; 10 000-15 000 ruplaa ulkopuolella; sähkö, vesi ja lämmitys 4 000-7 000 ruplaa kuukaudessa. Kokeneet vuokralaiset julkaisevat vinkkejä vuokrasopimusten neuvotteluun; käteismaksuja hyväksytään joskus; työntekijän näkökulmasta, onko pitkäaikainen vuokrasopimus allekirjoitettava, on edelleen keskeinen päätös.
Liikenneyhteydet ovat edelleen keskeinen ominaisuus: raitiovaunut, laajat rautatiet ja pikalinjat yhdistävät ulommat kaupunginosat keskustaan; työmatkat kestävät 15-35 minuuttia; tämä vähentää autojen osuutta; myöhäinen palvelu tukee työvuoroja; Kamyshin näyttää lyhyempiä junia; rautatiet ja raitiovaunut luovat laajan kattavuuden; asemia lähellä olevat tilat ovat suotuisassa asemassa; pitkän matkan reitit yhdistävät alueelliset keskukset muodostaen pisimmät käytävät.
Vastaus budjettikysymyksiin: tavoittele 25-40 m2 per henkilö; etsi yksiöitä 3-5 kilometrin säteellä keskustasta; arvioi sähkön, veden ja lämmityksen ilmaston mukaan; tarkista vuokrasopimuksen kieli sisältyvän lämmityksen tai kuuman veden osalta; valitse rakennus, jossa on mittarit; vahvista tilat, kuten pesula, kuntosali, pysäköinti; hintarakenne suosii massapääsyä; kansainvälisillä markkinoilla kokeneille tällainen vertailu paljastaa suuria eroja vuokran ja palkan välillä; julkaise ilmoituksia, käytetyt vaihtoehdot voivat vähentää käteismenoja; vakautta etsiville pitkäaikainen vuokrasopimus rakennuksessa, jossa on luotettava huolto, auttaa välttämään myöhästymismaksuja; tämä lähestymistapa tuottaa alhaisimman osuuden käteistä, joka käytetään asumiseen. Tämä ohje auttaa lukijoita vuokrasopimuksen valinnoissa.
Liikennekustannukset: Moskovan 5p hinnat Aasian verkostossa ja miten se vertautuu kansainvälisesti
Suositus: riippumatta siitä, matkustatko töihin tai opiskelemaan, tilaa kuukausikortti, jos päivittäiset matkasi itäisessä verkostossa ovat tiheitä; muuten käytä lippuja joustavuuden vuoksi. Tämä lähestymistapa tekee ajansäästöstä selvää ja vähentää käteisen kantamisen tarvetta.
- Ajoitetut aikavälit ja tiheys: Ajoitetut aikavälit vilkkaimmilla reiteillä ovat noin 2 minuutin välein ruuhka-aikoina ja noin 5 minuutin välein muuten, mikä lyhentää matka-aikaa ja parantaa työntekijöiden ja vierailijoiden liitettävyyttä.
- Liput ja maksu: Lippuja on saatavana yksittäisinä, usean matkan ja tilausmuodoissa; maksujärjestelmät sisältävät kortit, lompakot ja käteisen monissa paikoissa; tilaaminen ei vaadi joustavuuden menettämistä, eikä järjestelmä luota pelkästään paperilippuihin, mikä mahdollistaa nopeamman sisäänpääsyn ja paremman rahankäytön.
- Itäiset verkostot ja ympäristö: Itäiset järjestelmät yhdistävät keskeiset kaupungin kohteet, ja maanalaiset kerroksensiirrot yksinkertaistavat liikkumista; tämä ympäristö vähentää autojen käyttöä ja päästöjä samalla kun se tarjoaa luotettavaa palvelua.
- Annettujen kansainvälisten tietojen perusteella: Perushinnoittelu on täällä poikkeuksellisen alhainen suurkuluttajille; yleisesti ottaen länsimaiset ja muut alueelliset verkostot veloittavat huomattavasti enemmän matkaa kohti, mikä tekee tästä kehyksestä erityisen houkuttelevan pitkäaikaisille käyttäjille ja säästää rahaa ajan myötä.
- Kiovan vertailukohta ja paikallinen politiikka: Kiova käyttää monitasoista mallia jälkimaksullisilla vaihtoehdoilla; heidän vilkkaimmat käytävänsä osoittavat vahvaa kysyntää; kaupungin viranomaisten äskettäinen viesti ilmoitti päivitetyistä paketeista; ammattiliittojen kannat heijastavat jatkuvia keskusteluja hinnoittelusta ja tuista, ja useat sidosryhmät punnitsevat kohtuuhintaisuutta ja järjestelmän kestävyyttä.
- Käytännön käyttövinkkejä: Jos haluat välttää ajanmenetyksiä, suunnittele reitit minimoimaan siirrot; muuten käytä maksutapaa, joka tukee jälki- ja eteenpäin suunnittelua; oikean vaihtoehdon valinnalla säästetty raha voidaan sijoittaa uudelleen matkasuunnitteluun vuosien varrella.
Päivittäiset kulut: ruokaostokset, ulkona syöminen ja päivittäiset hinnat Moskovassa verrattuna 19 muuhun kaupunkiin
Tee hintaseuranta keskeisille ruokaostoksille tällä viikolla; päivitä tiedot kahden viikon aikataulussa; seuraa kiinteää koria kolmessa suuressa ketjussa, alennusmyymälöissä ja lähiömarkkinoilla paljastaaksesi samat hintaerot; vertailun tekeminen näiden myymälöiden ympärillä on tarkkaa. Tiheät muutokset heijastavat työvoimakustannuksia, verkostoja ja paikallisia olosuhteita vuosikymmenien aikana; toisin kuin uutisotsikot, tiedot mittaavat todellisia kustannuksia, joita tarpeet, raha ja matkat kohtaavat.
Ruokakori: Maito 1 L 75-110 ruplaa; Leipä 0,5 kg 40-60 ruplaa; Munat 12 kpl 120-180 ruplaa; Kananfilee 1 kg 260-420 ruplaa; Omenat 1 kg 90-170 ruplaa; Riisi 1 kg 70-120 ruplaa; Perunat 1 kg 60-100 ruplaa; Sipulit 1 kg 60-90 ruplaa. Viikoittaiset kustannukset 6 000-9 000 ruplaa. Vertaismarkkinoilla korit voivat olla 1,2-1,6 kertaa korkeammat.
Ulkona syöminen: Edullinen ateria yhdelle 500-800 ruplaa; Kahden hengen keskitason illallinen 2 000-3 800 ruplaa; Cappuccino 180-350 ruplaa; Kuukausittaiset kokonaiskustannukset ulkona syömiselle noin 1 000-3 000 ruplaa.
Päivittäiset matkakustannukset: Kuukausittainen matkakortti 3 000-4 000 ruplaa; Yksittäinen metromatka 50-60 ruplaa; Viikonlopun retkibudjetti noin 1 000-2 000 ruplaa.
Näitä lukuja muokkaavia tekijöitä ovat työvoima, hintojen ehdollistaminen, toimitusverkostot ja energiakustannukset; painotus muuttuu turistiryhmän myötä; nämä tiheydet luovat korkeampia tuloksia huippujen aikana; maailmanluokan markkinapaikat tarjoavat premium-vaihtoehtoja, maantieteellisesti sijoitettuja pidempiä matkoja.
Ukrainalaiset tuotteet näkyvät usein kausiluonteisissa valikoimissa; paikallisesti kasvatettuihin tuotteisiin siirtyminen alentaa menoja, mitä kompensoi kypsyys ja varastoinnin pituus; tarpeet vaihtelevat kotitalouksittain; budjetointi on edelleen olennaista.
Käytännön vinkkejä: aloita kiinteällä korilla; testaa kahta myymälää ydintuotteille; siirry verkkotoimitukseen välttääksesi ruuhka-ajan ostokset; käytä varhaisaamun ostosikkunoita; kierrätä peruselintarvikkeita kauden mukaan arvon maksimoimiseksi; vertaa laatua hintaan ennen ostoskorin täyttämistä.
Kulttuurinen pääsy budjetilla: museoiden, tapahtumapaikkojen ja tapahtumien hinnoittelu Moskovassa
Osta niputettu kaupunkikortti, joka tarjoaa museosisäänpääsyjä ja liikennerahaa; tarkista aukioloajat virallisilta sivuilta ennen vierailuja; käytä metroa nopeaan reititykseen; pidä kustannukset takaisin tavoitebudjetissa.
Lippujen hinnat suuriin kokoelmiin ovat noin 600-1000 ruplaa aikuisilta; alennuksia on opiskelijoille ja senioreille; monipaikkaisia kortteja on olemassa; useat laitokset julkaisevat ilmaisia tunteja tai ensimmäisen vierailun ikkunoita tietyinä arkipäivinä; toisin kuin kiinteät kiertuepaketit, nämä ikkunat tarjoavat joustavuutta, joten ennen lähtöä tarkista aikataulu tapahtumapaikan sivulta. Opas vertaa hintatasoja eri tapahtumapaikoissa.
Käytä metroa, jota kutsutaan myös metrosubwayksi, vähentääksesi kuljetuskustannuksia; verkosto toimii tiheillä palveluilla; selkeät kerrosasettelut; mukavat autot; matkustajien tulisi suunnitella reitit, jotka välttävät takaisinajoa ja hukkaan heitettyä aikaa. ratpfr-hinnoittelumallit näkyvät joskus liikennevertailuissa, joten ota ne huomioon kustannuskuvassa.
Kolme budjetointimallia ohjaavat matkustajia: lippu-lippu, kaupunkikortti, avoimen vierailun asettelut; hinnoittelutilat vaihtelevat tapahtumapaikan tyypin mukaan; kontekstina aiemmat näyttelyt voivat sisältää alueellisia aiheita, kuten ukraina; tarkista kunkin tapahtumapaikan sivustolta tarkat ehdot; tämä käytäntö auttaa hallitsemaan kulutusta samalla kun tarjotaan laajoja etuja budjeteille. Anna vinkkejä muille matkustajille luotettavan suunnitelman rakentamiseksi.
Kuten matkustajille avautuva osteri, ilmaiset tunnit, alennetut liput ja edulliset esitykset paljastavat runsaan valikoiman vaihtoehtoja; vaikka huippusesonkeja onkin, tämä lähestymistapa pitää takaisin järkevän budjetin samalla kun mukavat palvelut palvelevat matkustajia; rakenna suunnitelma, joka sopii aikatauluun, pitää matkan kevyenä ja jakaa kulttuurikokemuksen ystävien kanssa.
Turvallisuus, terveydenhuolto ja elämänlaatu: indikaattorit Moskovan vertaamiseksi globaaleihin metropoleihin
Suositus: toteuta standardoitu vertailukehys kolmelle pilarille: turvallisuus, terveydenhuollon saatavuus, elämänlaatu; rakenna yhdistetty indeksi, jossa yhdistyvät objektiiviset indikaattorit asukkaiden mielipiteisiin; julkaise neljännesvuosittaisia raportteja. Esimerkkitiedot; keskuspohjaiset kojelaudat näyttävät, miten useimmat globaalit metropolit suoriutuvat.
Keskeisiä indikaattoreita ovat rikosaste per 100k; hätävasteaika; poliisin läsnäolon tiheys; sairaalapaikkoja per 1 000; lääkäreitä per 1 000; rokotuskattavuus; ilmanlaatuindeksi; katujen valaistuksen luotettavuus; odotusajat klinikoilla.
Tietolähteet: viralliset tilastotoimistot; kansainväliset järjestöt; wikipediaorg; omistetut portaalit, kuten mexicometroorg, seoulmetrocokr; kuukausittaiset tarkistukset; tarpeet tarkistusta, onko aukkoja olemassa; huomioi alueelliset raportointisyklit; toinen.
Liikenneturvallisuus: rautatiekalusto; metron toimintatila; aseman suunnittelu; siirtotilat; aikataulun noudattaminen; esteettömyysominaisuudet; toisen tason asemat sisältyvät käyttäjäkokemuksen heijastamiseksi.
Toteutusvaiheet: perusta tietokeskus; nimitä koordinaattori; aseta 6-12 kuukauden aikataulu; kerää perustason mittarit kuukausien 1-3 aikana; tarkenna metodologiaa kuukausien 4-6 aikana; julkaise ensimmäiset tulokset; siirrä oppitunnit kunnallisyksiköihin; näet melko selkeyttä.
Tulosten käyttötarkoitukset: läpinäkyvä keskus tarpeiden seuraamiseksi; yhtenäinen tietolähestymistapa; vertaa tuloksia vertaisiin; antaa asukkaille mahdollisuuden arvioida työvoiman liikkuvuutta; asunnon kohtuuhintaisuutta; liikenteen mukavuutta; esimerkki: keskuspohjaiset kojelaudat heijastavat aseman tason suorituskykyä; useimmat metroalueet hyötyvät kalustotiedoista; toiminnallinen palaute.


